Category Archives: Computer

Netdata Statistics Overview

How to monitor with Netdata, for absolute beginners

Netdata offers a wealth of metrics and alerts out-of-the-box, enabling the user to get an in-depth understanding of their system without having to set up anything at all.

From the beginning, we wanted to create a tool that everyone can use. A robust monitoring solution that is easy enough for all users that need to understand why their system is misbehaving.

Fast forward a couple of years, and we are proud of a solution that is not only very wide but also very performant.

That being said, we know that it can be daunting at times, due to a large number of available metrics. It hasn’t had to be that way though.

Let’s see what insights we can get about our systems without having to dig into hundreds of charts. This work could not have been done without the help of our Senior DevOps engineer @Austin_Hemmelgarn :fist::rocket:

Remember

We will be looking into a limited number of charts. Netdata has more than 200 integrations and we are proud of our coverage.

Learn more about our integrations

System Overview Section


This is the most obvious of the charts. it’s a great overview of our system and we should start troubleshooting only if:

  1. We observe performance issues
  2. System overview shows abnormal metrics.

A Note on the ordinary
In this guide, we will often mention the following phrase “metrics out of the ordinary”. This notion is very important.

In order to truly understand the metrics of your system (and subsequently set the optimal values for the default alerts), you need to monitor you system under normal load/condition over a prolonged amount of time (e.g say a week).

CPU charts


IOwait

It’s the time that the CPU waits for an IO operation to complete. It could be running other things, but it doesn’t.

How do I read this?
High iowait means that the system is iowait constrained. Usually, this is related to Hard Disk work, but it could be other hardware as well. If I see a consistently low value, that means that I use the CPU efficiently.

softirq

It’s the time spent on hardware interrupts handlers. For example, network code is very softirq heavy, as the CPU spends time in kernel mode to handle the network packets.

How do I read this?
It should be very low. Consistently high values mean that the system is not able to keep up with (probably) the network traffic.

CPU Pressure Stall Information (PSI)

In the abstract, it’s a measure of home much time is spent waiting for a resource to become available. The CPU could run other tasks, but can’t find an available CPU core.

This is only available on Linux systems. FreeBSD and MacOS don’t support this, thus you won’t find this chart on these systems.

How do I read this?
If you are not utilizing 100% of your CPU, this should be zero. Keep track of this for a couple of days to see the whole range of the “expected” spikes. You can set a new alert for a spike beyond the highest spike under normal load, that way you will know when an abnormal load is detected.

CPU Load

It’s the running average of the processes that are waiting for resource availability. Historically, it has been the only measure of CPU performance issues.

The difference with CPU PSI:

How do I read this?
Load measures how many processes are waiting for resource availability, while PSI measures how much time applications are waiting for resource availability.

Generally speaking, we care more about PSI than Load. If we are going to use Load, we should keep track of load1 because by the time the other running averages are high, then it’s already too late. The system is already throttled.

A rule of thumb is to set an alarm for the following value: 8(or 16)*number_of_cpu_cores. Note that this can greatly vary (ever 4 times could be too high) and it’s possible that by the time the alert is raised, that you can’t interact with the system due to the load.

Disk Charts


Disk IO

The first chart measures the DiskIO. It’s necessary to run Disk benchmarks to truly find the peak of your system and set the alerts accordingly.

How do I read this?
First I run my benchmarks to understand the peak performance of the disks. If I observe that during normal load the disk consistently reaches near the peak performance, then what I do is probably disk io bound and I need to upgrade my disk.

PageIO

It measures the data that is pulled from memory. Usually, it’s close to DiskIO.

Disk PSI

Conceptually, it’s the same as CPU PSI. The amount of time that processes are waiting in order to be able to perform DiskIO.

How do I read this?
The charts should be zero most of the time. If they are consistently non-zero, then the disk is a limiting factor on the system and we need to upgrade it.

Important Note
Viewing your Netdata dashboard is actually heavy in Disk IO, as data is being streamed directly from the system to your browser. That means that you will need to look at this chart at a time when you weren’t viewing the dashboard.

RAM Charts


RAM utilization

It’s the absolute physical memory in use.

How do I read this?
Ideally, I don’t want to see anything listed as free. If I have a lot of free memory, that means that I have more memory than I need. used should be approximately a bit above 50% and it shouldn’t be a lot larger than cached.

If buffers are very high, that means that the system is under heavy network load. Even in a large server, buffered should be. a couple of hundred MBs. buffers are used to store network packets to be processed by the CPU.

Note
A system where the main application is taking care of memory caching (instead of the system) could have a lot of used and almost no cached. This is very rare and probably does not concern most of us.

RAM PSI

Conceptually, is the same metric as CPU PSI.

How do I read this?
If RAM PSI is consistently above zero, then the speed of my memory modules is a limiting factor. I need to get faster (not bigger) RAM.

RAM swap usage

When the system can’t find the memory it needs, it creates files on the hard disk and uses them as a sort of very slow memory.

Note
It’s worth noting that mac, Linux, and FreeBSD have an unintuitive use of swap. They will remove the swap files when no running process is referencing them, not when memory is freed. That means that a long-running process will continue to use swap files even if there is available memory.

To solve this, we should either reboot the system, restart the processes or disable and enable swap.

Network Charts


Total Bandwidth

It’s the total actual data that is being sent and received by the system.

How do I read this?
You need a baseline to read this. If you have consistently more traffic than expected, then something is off.

Important Note
Viewing your Netdata dashboard is actually heavy in network usage, as data is being streamed directly from the system to your browser. That means that you will need to look at this chart at a time when you weren’t viewing the dashboard.

Processes Charts


Blocked processes

It shows the number of processes that want to run but are waiting for something (e.g IO).

How do I read this?
It’s relevant to the baseline of the system. To consistently have 0-1 blocked processes is normal. If you have a bad disk, the number of blocked processes will be higher. Thus, a consistently high number may indicate some bottleneck in your system.

Context switches

It’s the number of times the CPU has to change context (e.g stop a process and run another, or stop userspace to jump into kernel space and process a packet).

How do I read this?
It’s relevant to the baseline of the system. High context-switching means that the system is not running efficiently, as the system has to change the context a lot of times. It’s a very costly operation for the CPU. To rectify an issue relevant to context switching is very related to the load that you are running.

A good rule of thumb is to check this chart if you observe performance issues but all the other charts appear normal.

Idlejitter


It measures how “off” is the CPU when performing very carefully timed operations. It’s relevant only when you care about ** real-time** applications, such as VOIP, driving servo motors and, time servers.

Softnet

It counts network receive interrupts processed by the kernel.

How do I read this?
We mainly care about 2 dimensions that should be zero most of the time. If you can’t see them, that’s a good thing, as Netdata will not display dimensions that are 0.

  • dropped should always be zero, if it is non-zero your system is having serious issues keeping up with network traffic.
  • squeezed should be zero, or no more than single digits. If it’s in the double digits or higher the system is having trouble keeping up, but not to the point of losing packets.

Personal computers that have been converted to homelab servers usually have non-zero dimensions, as they are not designed to handle a lot of network bandwidth.

CPU


CPU Idle

It’s a good measure of CPU utilization, but the baseline really depends on the CPU architecture.

How do I read this?
The dimensions are sorted in the legend by efficiency. That means that the higher is the dimensions to the right of the legend, the more efficient our system is.

Memory Section


OOM kills

it shows the absolute number of processes that were killed because the system could find enough memory.

How do I read this?
A healthy system should not have any OOM kill. If the dimension is non-zero, that means that the system desperately needs more memory.

As a stop-gap measure, we should add more swap memory.

Disks section


IO backlog

The number of pending operations that haven’t been dispatched yet.

How to read this?
On an ideal system, this should be zero. In practice, this sill is non-zero every now and then, simply because of the IO that the system has.

It’s relevant to the baseline of the system. You want to see observe the graph for a specific period and set your alerts above the peaks that you see.

Note that if you run backups, these are particularly taxing on IO, so you will need to take those peaks into consideration.

Per Filesystem


Available storage per filesystem. This is customizable.

How do I read this?

In most cases, you don’t need to. We have 2 different alerts enabled, one for available storage and one that measures the speed with which the storage is filled.

Networking Stack Section


tcp

It shows TCP connection aborts.

How do I read this?

All the dimensions of this chart should be zero. If there are non-zero dimensions, that means that there is something in the network, that is not behaving well (e.g a router, the network card on the system, etc.) Consistently high numbers point to a bad network card and you will need to change that.

High numbers of connection aborts mean that your system can’t handle the number of connections, probably due to low available memory.

High numbers of time-outs mean that there is some error in the network path between your systems and the system with which you are having the connections.

IPv4 Networking Section


errors

It shows the number of errors in the IPv4 stack of the system.

How do I read this?

All the dimensions should be zero. Constant non-zero dimensions means that the system is not functioning as expected, in regards to it’s networking.

Applications Section


Interestingly, this section has the same group of metrics that are available in the System Overview Section. The difference is that they are grouped in a per application group basis.

The application groups are defined in the apps_groups.conf.

The user can customize it by running the following command. We assume that the netdata configuration lives in /etc/netdata. Depending on the installation method, this can vary.

/etc/netdata/edit-config apps_groups.conf

The reason we group different processes into application groups is that the user cares about the “functionality” of a certain application, more than they care about the implementation details.

We care about the “web server”, not if it’s nginx or appache.

Moreover, the user could care about the aggregate behaviour all the “databases” that live in the system.

How do I read this?

The workflow we follow is again, a baseline one. We live the system running under normal load to define our baseline metrics. All the readings afterward will be against that baseline.

First, you observe that the system in the aggregate is not behaving as it should, using the charts and alerts we described above. Then, we zero in the Applications Section to see what exactly is misbehaving.

Apps Open Files


It shows the open files of every application group. There is a limit, set by the system, for how many open files a process can have and how many open files the system in the aggregate can have.

How do I read this?

If the process keeps dying and there is a spike in this chart, it could signal that the particular process is opening too many files. We may need to increase the limit or investigate if the application is being unreasonable.

User Groups, Users Sections

These sections have the same set of charts as the Applications Section. The difference here is that the charts are grouped by User and Group respectively, instead of by Application.


cgroups virtualization, containers, etc.

As in the Users, User groups, and applications groups, Netdata will gather the same set of metrics and organize them by cgroup.

Usually, this is very useful to monitor Docker Containers, but Netdata supports many different virtualization options.


What does Robocopy mean by tweaked, lonely, and extra? 

The Robocopy documentation for the option /it is simply “Includes ‘tweaked’ files”. What does “tweaked” mean?

The Robocopy documentation for the option /xl is simply “Excludes ‘lonely’ files and directories”. What does “lonely” mean?

“Tweaked”:

A Tweaked file is defined to be one that exists in both the source and destination, with identical size and timestamp, but different attribute settings.

“Lonely”:

A “lonely” file is present in source but not destination; excluding lonely will prevent any new files being added to the destination.

“Extra” (the other one that isn’t explained well):

An “extra” file is present in destination but not source; excluding extras will prevent any deletions from the destination.

Source: What does Robocopy mean by tweaked, lonely, and extra? – Super User

Suggested Robocopy Switches Explained | RainingForks Tech Blog

Suggested Robocopy Switches Explained

Windows’ robocopy.exe is a great command line program to quickly copy or fully backup your files, but there’s a lot of confusion out there about how to use its (not very well-documented) switches.  Here’s just what you need to know:


First of all, you probably already know that typing “robocopy /?” will give you a long list of switches to choose from.  Start there if you’re confused.  But since there are a LOT of choices, and they’re not well-explained, here’s a run-down of what I typically use, as I go about my day as an IT guy:

The basic format is: robocopy <source path> <destination path> <switches>

NOTE: I’ve found that using robocopy to copy across a network doesn’t always work using mapped drives!  Instead, use the full path (especially important when running as a Task in Windows Task Manager). For example, instead of “robocopy C:\Foo S:\Foo” do this: “robocopy C:\Foo \\SERVER\Foo”

Another tip is if you’re using file paths that contain spaces, then you need to enclose each path in quotes. If no spaces, then quotes are optional.

/FFT is necessary to copy between file systems, such as Windows’ NTFS and Linux’s EXT4. If you don’t use this you can get wierdness like files looking like they’re newer than they really are, etc., since the two file systems keep time differently.

/COPYALL copies ALL aspects of the file/directory, including ownership and permissions info. Required if you’re backing up a server or something that you want to maintain group/user permissions, etc. for. (NOTE: Don’t use this switch when copying files from Linux to Windows if you aren’t logged in as the same user with admin rights on both machines! If you do, you’ll get a lot of errors like “A required privilege is not held by the client” and “The revision level is unknown” as it creates a bunch of empty folders at your Windows destination, but skips copying all your files! Instead you can use the /COPY:DT mentioned below, and if you really need to backup your Linux ownership & permissions info, save all the files in a tarball and then just backup that single file containing the directories & files with their attributes intact to Windows.)

/COPY:DT to just copy files & date/time stamps. This is good if you’re just copying some files to give to a friend, and don’t need permissions, etc. copied. Also good for copying files from Linux to Windows (see “note” in /COPYALL above).

/FP outputs the full path so you can more easily see where it is while it’s running.

/MIR exactly mirrors the files & directories, so things at the destination will be deleted if they’re not at the source. (This is the same as using /PURGE (which deletes stuff at the destination that doesn’t match) with /E (which includes Empty subdirectories)

/ZB tells robocopy to use restartable mode (which you want for large files, especially over WAN/unstable connections, since it’ll try to pick up where it left off if the connection gets dropped or there’s corruption mid-copy), and if access is denied, then it’ll use Backup mode, which allows you to copy files you might otherwise not have access to, assuming it’s being run under an account with sufficient privileges (e.g., member of Backup Operators, Administrators, etc.). (NOTE: the /Z switch sometimes slows down the copy speed, so if you don’t need it, don’t use it, especially if you feel like your Robocopy job is taking longer than it should. Sometimes there’s no speed difference, and sometimes it can be dramatic.)

/MT stands for Multi-Threaded, and tells robocopy to copy multiple files at once. The default number of threads is 8 (max is 128), but be careful, as running this over a network can really saturate your bandwidth, leaving none for anyone else. As a result, you may want to skip this one or try specifying less threads by doing something like /MT:2 which will just run two threads (instead of 1, which is what you get if you omit /MT entirely). (NOTE: This is only available in newer versions of Robocopy (Win7/2008R2 and later).  If you’re running older versions (or just don’t feel like bothering with this switch), you can simply open multiple command prompt windows and run it in multiple instances – I often will run two or three Robocopy batch files simultaneously. Also, this switch will make file copy progress numbers confusing, so it’s best to use the /NP switch mentioned below to disable outputting the copy’s progress. Some people speculate that running multiple threads can increase fragmentation, but I haven’t seen any hard evidence of this, and with increasing adoption of solid state drives, it may not matter for much longer anyway.)

/R:1 /W:3 are two switches you probably want to use together to tell robocopy how many times to retry accessing a file (1 in this example), and how long to wait between retries (3 seconds in this example).  If you leave this out, it’ll retry 1 million times with a 30 second wait between each one when it encounters a file it can’t access!!!

/XD is what you use when you want to tell robocopy to skip (i.e., exclude) a directory. Just follow /XD with a space and then the path to what you want excluded. If there are multiple directories you’d like to skip, separate them with a space. For example: /XD “C:\Foo\private stuff” “C:\Foo\plans for world domination”

/LOG:C:\LogFileName.txt /TEE /NP are three switches you’ll want to use together if you want to write the results of the copy to a log file (called “C:\LogFIleName.txt” in this example). If you want it to write what’s happening to the screen as well as to the log file, then you’ll also want to include /TEE.  And, possibly most importantly, you want to include /NP in there so that it does NOT show the progress as each file copies. If you leave this out, then your log file will be filled with every single percentage complete it displays! So you’ll have something like this: “0.0% 0.1% 0.2%” and so on, to 100% FOR EACH FILE, which is nuts.

Finally, if you want to append log file output to the end of an existing file, rather than creating a new file every time, you can modify the above line to include a plus sign, like so: /LOG+:C:\LogFileName.txt

That’s pretty much all you need to know! I figured most of this out from trial & error, as well as some internet searches. Unfortunately, I’ve read so many incorrect, or confused posts about robocopy on the internet over the years, that I wanted to write this to set things straight.  Hopefully you find this helpful – if nothing else, at least I’ll now have a handy reference for the next time I need to put together a robocopy command… 😉

Source: Suggested Robocopy Switches Explained | RainingForks Tech Blog

Terminals

What is the difference between F1 and F2 Terminals?

F1 and F2 represent the type of connector that is located on the top of the battery. F1 terminals are .187 inch wide (the contact towards the end narrows) and F2 terminals are .250 inch wide (the contact towards the end narrows). Most emergency light applications use a F1 terminal and most emergency power backup (UPS) applications use F2 terminals.

FASTON CONNECTOR
F1
FASTON CONNECTOR

F2

What other common terminals are available?

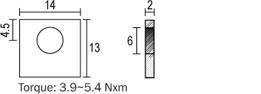
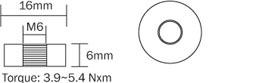
NUT AND BOLT

NB
THREADED INSERT

IT
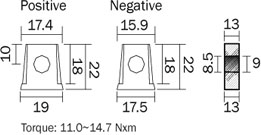
U CONNECTOR

U
INSULATED WIRE LEADS

WL
FASTON CONNECTOR

F1/0

Source: Terminals

DHCP Options in Plain English

DHCP Options in Plain English

Published on 18 May 2013

The following tables list common, configurable DHCP options. Non-configurable options or TLVs have not been included, even though these may be present in a file or on the wire. The following tables also do not include options that are only necessary for the operation of the DHCP protocol. For example, DHCPv4 option 53 is the DHCP message type option that declares whether a particular message is a discovery, request, or other message type. However, the administrator can’t configure this option, so therefore it isn’t included in the lists below.
Of course, there will be some DHCPv4, DHCPv6, and internal DHCP options that are not listed at all. This is because this document aims to act as a guide for the most commonly-used options only. For further information on other DHCP options, refer to the IETF website.

Table 1 – DHCPv4 Options

The table below describes DHCP options commonly used in IPv4 networks. Please note: Certain classes of devices will use particular subsets, as listed below:

  • Cable Modems: 1, 2, 3, 4, 6, 7, 51, 66, 67, 122.1, 122.2
  • MTAs: 1, 2, 3, 4, 6, 7, 51, 122.3, 122.6.  If in BASIC mode, also 66, 67
  • Generic devices: 1, 3, 6, 51
Option Number Option Name Source Description
1 Subnet Mask RFC 2132 The subnet mask to apply to the address that is assigned to the client.
2 Time Zone Offset RFC 2132 Informs the client about the time zone offset, in seconds.  For example, Pacific Standard Time is GMT – 8 hours.  This field would be filled with “- 28800”.  (Eight hours * 60 minutes/hour * 60 seconds/minute)
3 Gateway RFC 2132 Tells the client which router is the default router.
4 Time Server RFC 2132 Tells the client the IP address of a time server that can determine the client’s current time. This is related to the Time Zone Offset option.
6 Domain Name Server RFC 2132 Carries the IP address(es) of the DNS servers that the client uses for name resolution.
7 Log Server RFC 2132 Carries the IP address of the syslog server that receives the client’s log messages.
12 Hostname RFC 2132 Carries the hostname portion of a client’s fully qualified domain name (FQDN). For example, the “www” part of “www.example.com”.
15 Domain Name RFC 2132 Carries the domain name portion of a client’s fully qualified domain name (FQDN).  For example, the “example.com” portion of “www.example.com”.
43 Vendor Specific Information RFC 2132 Carries some configuration data that is not defined in the standard DHCP RFCs.  Individual vendors can define different pieces of data that may be found in this option. CableLabs’ eDOCSIS specification, for example, defines certain sub-options that appear in this option.
51 Lease Time Option RFC 2132 This defines the maximum amount of time that the client may use the IP address.
60 Vendor Class Identifier RFC 2132 Carries some identifier from the client that may identify the client’s device class. The DHCP specification does not define what values go into this field, but other specifications do. For example, the DOCSIS specifications state that if the device is DOCSIS-compliant, option 60 must start with “docsis” (and also include other details).
66 TFTP Server Name RFC 2132 Carries the FQDN or IP address (or cluster identifier) that the device should use to download the file specified in option 67.  Note that often the data put into option 66 does not actually appear in the DHCP packet as option 66, but may have been moved into the “sname” field of the DHCP packet.  Additionally, the FQDN may have been resolved to an IP address and also placed in the “siaddr” field of the DHCP packet.
67 Filename RFC 2132 Carries the filename that is to be downloaded from the server specified in option 66. Note that often data put into option 67 does not actually appear in the DHCP packet as option 67, but may be moved into the “file” field of the DHCP packet.  (Note: Address Commander can do some dynamic file name generation for this name.)
82 Relay Agent Information Option RFC 3046 This option carries many other sub-options that are added by relay agents and not the clients themselves.  Some of the common options are listed below.
82.1 Circuit ID RFC 3046 This is an identifier added by the relay agent to indicate which interface the client is on. This is commonly used as a subscriber identifier in DSL-based networks.
82.2 Remote ID RFC 3046 This is an identifier added by the relay agent to identify the client. It is commonly used as a subscriber identifier in DOCSIS-based networks.  DOCSIS mandates that this option is filled with the MAC address of the cable modem and applies to all traffic from the cable modem, or any device appearing from behind that cable modem.
122 CableLabs Client Configuration Option RFC 3495 This is an option defined by CableLabs to carry the information necessary to configure PacketCable devices. The sub-options are listed below.
122.1 TSP Primary DHCP Server RFC 3495 The multimedia telephony adapter (MTA) portion of the device listens to this IP address of the DHCP server. This has two special values, 0.0.0.0 (which will disable the MTA), and 255.255.255.255 (which will instruct the MTA to accept replies from any DHCP server).
122.2 TSP Secondary DHCP Server RFC 3495 A second DHCP server’s IP address.  Otherwise the same as option 122.1
122.3 TSP Provisioning Server’s Address RFC 3495 The MTA contacts the server listed to complete its provisioning process. This is the FQDN of a multimedia provisioning service (MPS), whether a specific MPS, or a cluster identifier.
122.6 TSP Kerberos Realm Name RFC 3495 For PacketCable secure mode provisioning, the name of the Kerberos Realm. There are four more special values that may be in this field: BASIC.1, BASIC.2, HYBRID.1, and HYBRID.2.  This indicates whether the device is in basic, hybrid, or secure mode provisioning. The “.1” and “.2” parts indicate whether the MTA notified the provisioning server upon completion of the provisioning process.


Table 2: DHCPv6 Options

The table below describes DHCP options commonly used in IPv6 networks.

Option Number Option Name Source Description
17 Vendor Specific Information Option RFC 3315 This option contains vendor-specific option data, much like DHCPv4 option 43.  There is an extra difference in that in DHCPv6, this option carries a vendor ID as well, which allows for data from multiple vendors to be provided to the device.
17[4491] CableLabs Vendor-Specific Information Option CL-SP-CANN-DHCP-Reg-I08-111117 CableLabs has specified a set of sub-options for use with DOCSIS-compliant DHCPv6 devices.  The vendor ID for CableLabs is 4491.
17[4491].32 TFTP Server Addresses option CL-SP-CANN-DHCP-Reg-I08-111117 This is a list of IPv6 addresses that the client will use to try to download its boot file (specified in 17[4491].33) using TFTP.
17[4491].33 Configuration File Name CL-SP-CANN-DHCP-Reg-I08-111117 The name of the file to download using the TFTP servers specified in 17[4491].32.
17[4491].34 Syslog Server Addresses CL-SP-CANN-DHCP-Reg-I08-111117 This is the DHCPv6 analogue to the DHCPv4 option 7.
17[4491].37 RFC868 Servers CL-SP-CANN-DHCP-Reg-I08-111117 This is the DHCPv6 analogue to the DHCPv4 option 4
17[4491].38 Time Offset CL-SP-CANN-DHCP-Reg-I08-111117 This is the DHCPv6 analogue to the DHCPv4 option 2.
23 DNS Recursive Name Server Option RFC 3646 This is the DHCPv6 analogue to the DHCPv4 option 6.
24 Domain Search List RFC 3646 This option specifies the list of domain names that the client should use when attempting to resolve basic host names.
39 DHCPv6 FQDN option RFC 4704 This option specifies the clients host and domain names. This is the analogue of both DHCPv4 option 12 and DHCPv4 option 15 combined. 

References

RFC 2132: http://datatracker.ietf.org/doc/rfc2132/
RFC 3046: http://datatracker.ietf.org/doc/rfc3046/
RFC 3495: http://datatracker.ietf.org/doc/rfc3495/
RFC 3646: http://datatracker.ietf.org/doc/rfc3646/
RFC 4704: http://datatracker.ietf.org/doc/rfc4704/
CL-SP-CANN-DHCP-Reg-I08-111117: http://www.cablelabs.com/specifications/CL-SP-CANN-DHCP-Reg-I08-111117.pdf

Source: DHCP Options in Plain English – Incognito Software

Suricata inline versus legacy IPS mode | Netgate Forum

 I will just add a little more detail to the explanation to highlight the differences between inline IPS mode and the legacy IDS/IPS hybrid mode.

In legacy mode, the pcap library is used to make a copy (clone if you will) of every packet as it comes in from the NIC on its way to the pf firewall engine.  The original packet continues on to the pf firewall engine and is either passed or blocked depending on the current rules in the firewall.  Meanwhile, the cloned packet is sent over to Suricata (or Snort if using that package) for inspection against the IDS/IPS rules.  Should the cloned packet (or packets, since sometimes Suricata needs to see a group of packets before a decision can be made) be judged as “bad” by the Suricata engine, then a system call is made to insert the offending IP address from the packet into a special table in the pf firewall engine called snort2c.  IP addresses in this special table are blocked.  However, note that this decision making and subsequent insertion of the IP address into the snort2c table has happened well after the original packet (or packets if a group of packets was required to make a decision) has traversed the pf engine.  So that original packet will have already gotten past the IPS mechanism.  Packets that subsequently come through from the same IP address will now get blocked, though.  Hence I use the term “hybrid IDS/IPS” because a true IPS would never leak a packet.  A true IPS would hold up the original packet while it was being inspected, and then either pass it or drop it.  Legacy mode does not hold up the original packet.  It is allowed to continue on to the firewall while the cloned copy is used to make the decision for blocking future packets from the IP address.

With the new inline IPS mode, Suricata activates and uses the relatively new Netmap mechanism that was added to FreeBSD.  Netmap is a way for applications to create a highspeed pipe between the NIC driver layer and the rest of the system.  So packets coming and going on a given network interface must pass through the Netmap pipe.  Suricata inline-mode controls the “door” in this pipe.  Each packet stream coming from the NIC (or going to the NIC) is inspected by Suricata and a “pass” or “drop” decision is made.  If a packet is dropped, it is never forwarded on to the pfSense kernel and thus never makes it to the pf engine.  Since every single packet must traverse this Netmap pipe, there is no leakage.  No copies of the packets are made for examination.  Everything occurs with the original packet.

The downside of the new inline mode is that for now only some NIC drivers support working with the Netmap API mechanism.  So while legacy mode is pretty much NIC card and driver agnostic (meaning it works with any hardware), the inline mode is highly dependent on your firewall having a NIC driver that supports Netmap.  Another problem that currently exists is the Netmap pipe seems to break traffic shaping on the interface.  I suspect this is a fixable problem, but no solution is in place yet.

So consider these two issues before choosing to use the inline IPS mode:  (1) do I have a supported NIC and driver; and (2) can I do without traffic shaping on interfaces where I run Suricata?

Source: Suricata inline versus legacy IPS mode | Netgate Forum

Note:

Important Information About IPS Inline Mode Blocking

When using Inline IPS Mode blocking, you must manually change the rule action from ALERT to DROP for every rule which you wish to block traffic when triggered.

The default action for rules is ALERT. This will produce alerts but will not block traffic when using Inline IPS Mode for blocking.

Use the “dropsid.conf” feature on the SID MGMT tab to select rules whose action should be changed from ALERT to DROP. If you run the Snort rules and have an IPS policy selected on the CATEGORIES tab, then rules defined as DROP by the selected IPS policy will have their action automatically changed to DROP when the “IPS Policy Mode” selector is configured for “Policy”.

How the browser renders a web page – DEV

How the browser renders a web page

My thinking: if I’m going to build websites that are fast and reliable, I need to really understand the mechanics of each step a browser goes through to render a web page, so that each can be considered and optimised during development. This post is a summary of my learnings of the end-to-end process at a fairly high level.


A lot of this is based on the fantastic (and FREE!) Website Performance Optimization course by Ilya Grigorik and Cameron Pittman on Udacity. I’d highly recommend checking it out.

Also very helpful was the article How Browsers Work: Behind the scenes of modern web browsers by Paul Irish and Tali Garsiel. It’s from 2011 but many of the fundamentals of how browsers work remain relevant at the time of writing this blog post.

Ok, here we go. The process can be broken down into these main stages:

  1. Start to parse the HTML
  2. Fetch external resources
  3. Parse the CSS and build the CSSOM
  4. Execute the JavaScript
  5. Merge DOM and CSSOM to construct the render tree
  6. Calculate layout and paint

Source: How the browser renders a web page – DEV

Some stuff about things