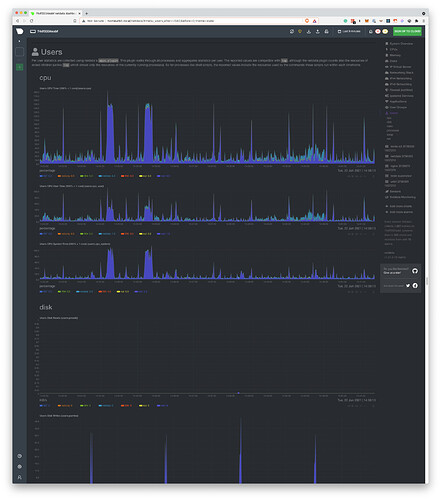
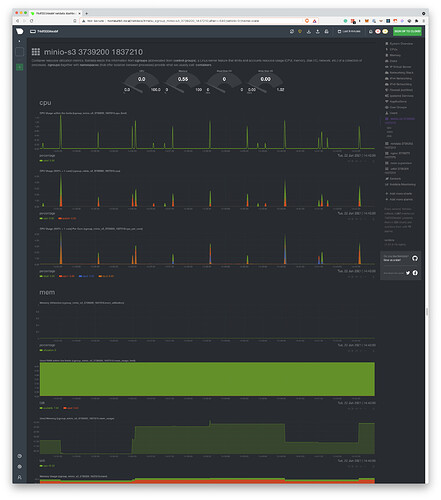
Source: What is Kerberos? Understanding Kerberos: What is it? How does it work?
Monthly Archives: July 2021
How to Build a Pinball Machine | pinball for the sake of pinball
Microsoft.PowerShell.Management Module – PowerShell | Microsoft Docs
Send-MailMessage: The PowerShell Way to Send Email
Table of Contents
The SMTP Server
All email has to go through an SMTP server somewhere via a server and a port. To specify a the SMTP server to use, use a parameter called SMTPServer that allows you to specify the SMTP server to establish a connection and relay mail through. However, it is not required.
If you don’t specify a value for the SMTPServer parameter, the value stored in the $PSEmailServer preference variable will be used. You can assign a value to this variable just like you would any other variable.
PS51> $PSEmailServer = 'smtp.server.local'However, this variable does not live across PowerShell sessions. This means you must define it every time a new PowerShell session is open. For this reason, I recommend either using it by defining it above your Send-MailMessage reference or not defining it all. Instead, I’d personally provide the SMTPServer parameter value. This way you don’t have to manage an outside variable that might change on you.
PS51> Send-MailMessage -SmtpServer 'smtp.server.local'Port
By default, the value that the cmdlet will attempt to send an email through the SMTP server is port 25. This is plain, unencrypted SMTP. However, nowadays, it’s more common to send encrypted email using SSL/TLS (We’ll cover these scenarios later).
If you need to change the port from 25, you can use the Port parameter.
PS51> Send-MailMessage -SmtpServer 'smtp.server.local' -Port 587Recipients and Originators
To send an email to different recipients via methods like the To, Cc and Bcc fields, the cmdlet has various parameters to accommodate this.
The To, Cc and Bcc Parameters in the Send-Mailmessage Cmdlet
The cmdlet has three parameters each supporting multiple recipients separated by a comma called To, Cc and Bcc.
You can specify single addresses like below.
PS51> Send-MailMessage -To joe@gmail.com -Cc bob@gmail.com -Bcc susie@hotmail.com -Subject 'this is a subject'Or you can specify multiple recipients for each parameter value.
PS51> Send-MailMessage -To joe@gmail.com, tony@mycompany.local -Cc bob@gmail.com, rick@othercompany.com -Bcc susie@hotmail.com,secret@fooorg.org -Subject 'this is a subject'The From Parameter
When sending email, you can also specify the From parameter which will set the reply-to header in the email. This parameter only allows one address. Should a recipient choose to reply to the email, this will be the email address that reply will come back to.
PS51> Send-MailMessage -From me@company.org -To joe@gmail.com -Subject 'this is a subject'By default, using an email address will simply show the email address in the recipient’s FROM field. However, if you’d like to specify a name or some kind of label like Service Account Mailbox, you may also specify a name and an email like:
Adam Bertram <adbertram@gmail.com>Notice that the
Subjectparameter was used. This parameter is always required. You’ll see this parameter used in all examples.
Body
The Body parameter allows you to specify what will be in the email body. At the most simplest, you can specify any text you’d like and the cmdlet will send it via plaintext.
PS51> Send-MailMessage -From me@company.org -To joe@gmail.com -Subject 'this is a subject' -Body 'this is the body'Sending HTML Body Emails
You can also send an email body via HTML rather than plaintext. To do that, use the same Body parameter as you would with plaintext but use HTML for the string and use the BodyAsHtml switch parameter.
$body = @'
<table style="width:100%">
  <tr>
    <th>Firstname</th>
    <th>Lastname</th>
    <th>Age</th>
  </tr>
  <tr>
    <td>Jill</td>
    <td>Smith</td>
    <td>50</td>
  </tr>
  <tr>
    <td>Eve</td>
    <td>Jackson</td>
    <td>94</td>
  </tr>
</table>
'@

PS51> Send-MailMessage -From me@company.org -To joe@gmail.com -Subject 'this is a subject' -Body $body -BodyAsHtml
Notice in the above example, I enclosed the body string in
@'and'@. This is called a here string. This allows you to define long strings typically seen in email bodies that contain carriage returns. Here strings preserve formatting of strings and is a great way to define the email body especially if it’s in HTML.
Encoding
If you have special characters in the subject or body of your email, you can use the Encoding parameter. This parameter allows you to encode the email subject and body via the specified encoding type before sending.
You have a few options here:
- ASCII (default)
- UTF8
- UTF7
- UTF32
- Unicode
- BigEndianUnicode
- Default
- OEM
PS51> Send-MailMessage -From me@company.org -To joe@gmail.com -Subject 'this is a subject' -Body 'this is the body' -Encoding UTF8Attachments
The cmdlet can also attach one or more files. To do so, you can use the Attachments parameter and provide the path to the file(s) you’d like to attach.
PS51> Send-MailMessage -From me@company.org -To joe@gmail.com -Subject 'this is a subject' -Body 'this is the body' -Attachments 'C:\file.doc'You can also specify multiple attachments via a collection by separating them with a comma.
PS51> Send-MailMessage -From me@company.org -To joe@gmail.com -Subject 'this is a subject' -Body 'this is the body' -Attachments 'C:\file.doc','D:\report.xlsx'The Attachments parameter also allows you to pipe files via cmdlets like Get-Item and Get-ChildItem to the Send-MailMessage cmdlet as well.
PS51> Get-ChildItem -Path 'C:\MyFiles' | Send-MailMessage -From me@company.org -To joe@gmail.com -Subject 'this is a subject' -Body 'this is the body'Secure and Authenticated Email
By default, the cmdlet sends email via unencrypted SMTP communication over port 25. However, it also has support for sending encrypted email via SSL/TLS with a username and password.
If you attempt to relay email through an SMTP server that requires authentication, the command fails with an error message like below.
The SMTP server requires a secure connection or the client was not
authenticated. The server response was: 5.7.0 Must issue a STARTTLS command first.
To remedy this, you must first specify the port (typically 587 for TLS) and the UseSsl parameter. This tells the cmdlet to attempt to connect to port 587 on the SMTP Server and encrypt the entire message. You will typically (always?) also need to specify the username/password to authenticate to the SMTP server by using the Credential parameter.
PS51> $credential = Get-Credential
PS51> Send-MailMessage -From me@company.org -To joe@gmail.com -Subject 'this is a subject' -Body 'this is the body' -UseSsl -Port 587 -Credential $credential
Above I’m grabbing a credential (PSCredential) object using the
Get-Credentialcmdlet. This sometimes poses a problem because it’s interactive meaning it stops the script to ask for a username and password. To prevent this, you could create a PSCredential object on the fly.
A common email example is to use Gmail. Using the knowledge you’ve gained above, you can now easily send email through Gmail using the smtp.gmail.com SMTP server as shown below.
$gmailCred = Get-Credential

$sendMailParams = @{
    From = 'adbertram@gmail.com' ## Must be gmail.com
    To = 'someemail@domain.com'
    Subject = 'some subject'
    Body = 'some body'
    SMTPServer = 'smtp.gmail.com'
    SMTPPort = 587
    UseSsl = $true
    Credential = $gmailCred
}

Send-MailMessage @sendMailParams
Assigning Email Priority
Although one feature of email I personally wish would die, you can assign priority levels to the emails you send via the Priority parameter. This priority is then interpreted in various ways by the email client.
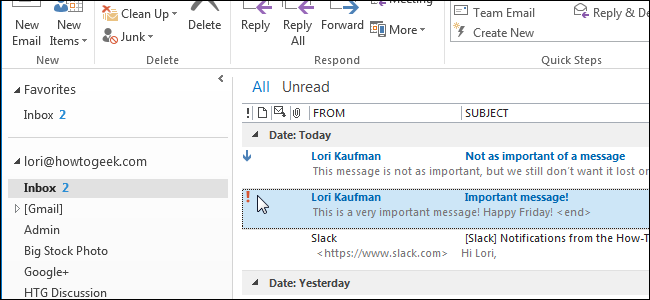
Send-mailmessage allows you to assign an email with three different priorities.
- Normal (default)
- High
- Low
PS51> Send-MailMessage -From me@company.org -To joe@gmail.com -Subject 'this is a subject' -Body 'this is the body' -Priority HighBut please, for the love of God, don’t think all of your emails are high priority!
Delivery Notifications
Finally, you can specify delivery notifications for emails. Delivery notifications are what’s typically known as read receipts in some email clients. Delivery notifications allow you to be notified if/when the email is received by the recipient. However, the recipient must still allow it.
You have four options when requesting delivery notifications.
- None (default)
- OnSuccess (when the email is delivery is successful)
- OnFailure (notify if the delivery is unsuccessful)
- Delay (when the email is delayed via an SMTP server)
You can specify a delivery notification option by using the DeliveryNotificationOptions parameter.
PS51> Send-MailMessage -From me@company.org -To joe@gmail.com -Subject 'this is a subject' -Body 'this is the body' -DeliveryNotificationsOptions 'OnSuccess'You can also request multiple delivery notifications at once by separating them with a comma.
PS51> Send-MailMessage -From me@company.org -To joe@gmail.com -Subject 'this is a subject' -Body 'this is the body' -DeliveryNotificationsOptions 'OnSuccess','OnFailure','Delay'Summary
In this post, you learned all about the Send-mailmessage cmdlet and what it can. We covered this cmdlet extensively using every parameter it has along with examples. I hope this post can server as a reference for you when using the Send-mailmessage cmdlet.
Further Reading
Be sure to check out some other related posts!
Fix Windows 10 privacy
Source: Fix Windows 10 privacy
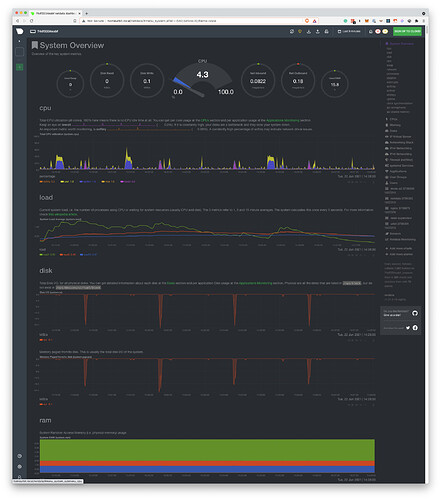
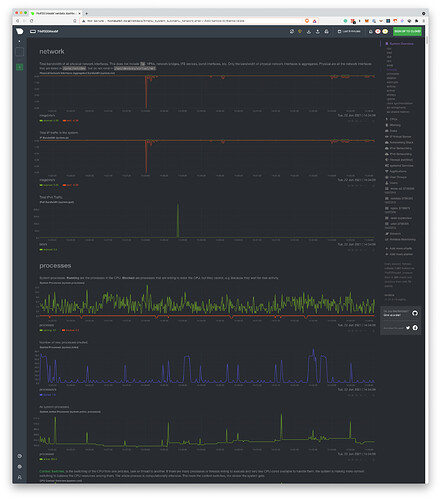
Netdata Statistics Overview
How to monitor with Netdata, for absolute beginners
Netdata offers a wealth of metrics and alerts out-of-the-box, enabling the user to get an in-depth understanding of their system without having to set up anything at all.
From the beginning, we wanted to create a tool that everyone can use. A robust monitoring solution that is easy enough for all users that need to understand why their system is misbehaving.
Fast forward a couple of years, and we are proud of a solution that is not only very wide but also very performant.
That being said, we know that it can be daunting at times, due to a large number of available metrics. It hasn’t had to be that way though.
Let’s see what insights we can get about our systems without having to dig into hundreds of charts. This work could not have been done without the help of our Senior DevOps engineer @Austin_Hemmelgarn 

Remember
We will be looking into a limited number of charts. Netdata has more than 200 integrations and we are proud of our coverage.
Learn more about our integrations
System Overview Section
This is the most obvious of the charts. it’s a great overview of our system and we should start troubleshooting only if:
- We observe performance issues
- System overview shows abnormal metrics.
A Note on the ordinary
In this guide, we will often mention the following phrase “metrics out of the ordinary”. This notion is very important.
In order to truly understand the metrics of your system (and subsequently set the optimal values for the default alerts), you need to monitor you system under normal load/condition over a prolonged amount of time (e.g say a week).
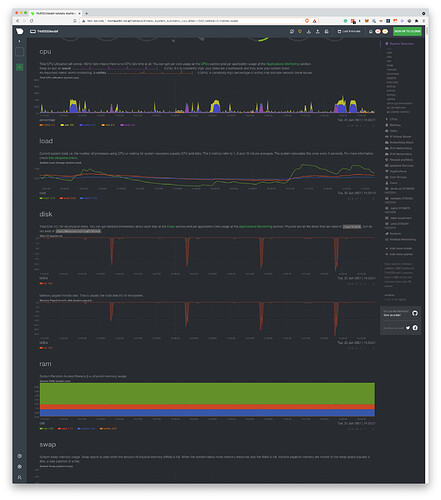
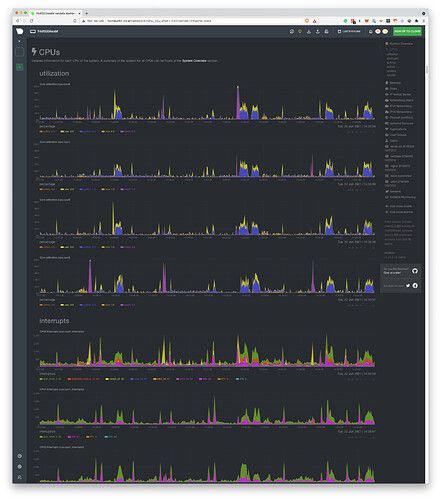
CPU charts
IOwait
It’s the time that the CPU waits for an IO operation to complete. It could be running other things, but it doesn’t.
How do I read this?
High iowait means that the system is iowait constrained. Usually, this is related to Hard Disk work, but it could be other hardware as well. If I see a consistently low value, that means that I use the CPU efficiently.
softirq
It’s the time spent on hardware interrupts handlers. For example, network code is very softirq heavy, as the CPU spends time in kernel mode to handle the network packets.
How do I read this?
It should be very low. Consistently high values mean that the system is not able to keep up with (probably) the network traffic.
CPU Pressure Stall Information (PSI)
In the abstract, it’s a measure of home much time is spent waiting for a resource to become available. The CPU could run other tasks, but can’t find an available CPU core.
This is only available on Linux systems. FreeBSD and MacOS don’t support this, thus you won’t find this chart on these systems.
How do I read this?
If you are not utilizing 100% of your CPU, this should be zero. Keep track of this for a couple of days to see the whole range of the “expected” spikes. You can set a new alert for a spike beyond the highest spike under normal load, that way you will know when an abnormal load is detected.
CPU Load
It’s the running average of the processes that are waiting for resource availability. Historically, it has been the only measure of CPU performance issues.
The difference with CPU PSI:
How do I read this?
Load measures how many processes are waiting for resource availability, while PSI measures how much time applications are waiting for resource availability.
Generally speaking, we care more about PSI than Load. If we are going to use Load, we should keep track of load1 because by the time the other running averages are high, then it’s already too late. The system is already throttled.
A rule of thumb is to set an alarm for the following value: 8(or 16)*number_of_cpu_cores. Note that this can greatly vary (ever 4 times could be too high) and it’s possible that by the time the alert is raised, that you can’t interact with the system due to the load.
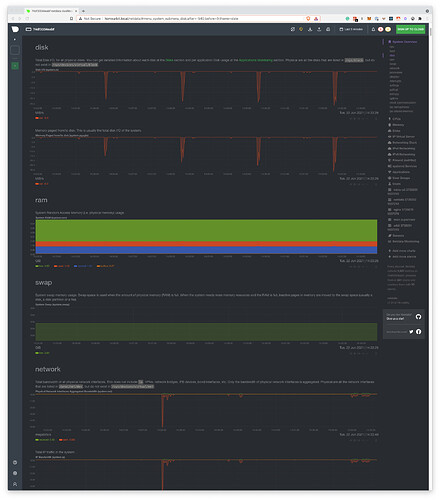
Disk Charts
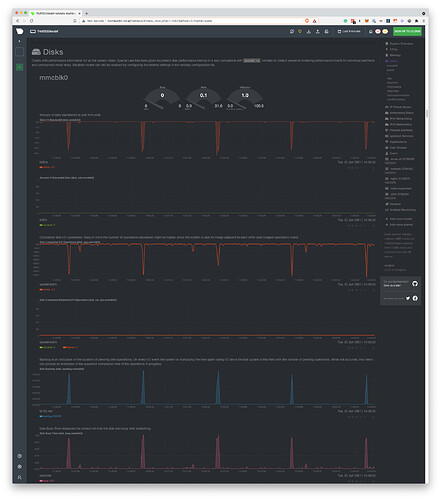
Disk IO
The first chart measures the DiskIO. It’s necessary to run Disk benchmarks to truly find the peak of your system and set the alerts accordingly.
How do I read this?
First I run my benchmarks to understand the peak performance of the disks. If I observe that during normal load the disk consistently reaches near the peak performance, then what I do is probably disk io bound and I need to upgrade my disk.
PageIO
It measures the data that is pulled from memory. Usually, it’s close to DiskIO.
Disk PSI
Conceptually, it’s the same as CPU PSI. The amount of time that processes are waiting in order to be able to perform DiskIO.
How do I read this?
The charts should be zero most of the time. If they are consistently non-zero, then the disk is a limiting factor on the system and we need to upgrade it.
Important Note
Viewing your Netdata dashboard is actually heavy in Disk IO, as data is being streamed directly from the system to your browser. That means that you will need to look at this chart at a time when you weren’t viewing the dashboard.
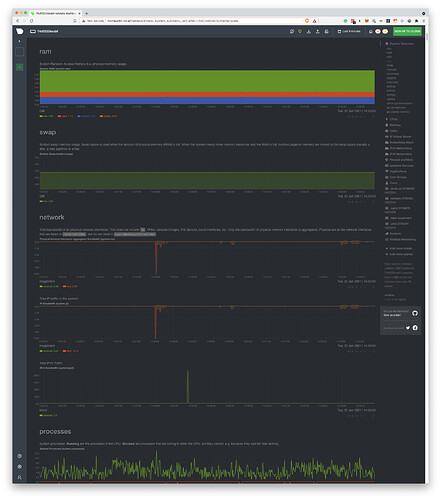
RAM Charts
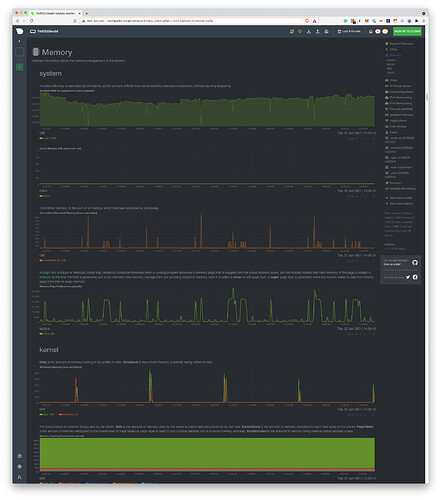
RAM utilization
It’s the absolute physical memory in use.
How do I read this?
Ideally, I don’t want to see anything listed as free. If I have a lot of free memory, that means that I have more memory than I need. used should be approximately a bit above 50% and it shouldn’t be a lot larger than cached.
If buffers are very high, that means that the system is under heavy network load. Even in a large server, buffered should be. a couple of hundred MBs. buffers are used to store network packets to be processed by the CPU.
Note
A system where the main application is taking care of memory caching (instead of the system) could have a lot of used and almost no cached. This is very rare and probably does not concern most of us.
RAM PSI
Conceptually, is the same metric as CPU PSI.
How do I read this?
If RAM PSI is consistently above zero, then the speed of my memory modules is a limiting factor. I need to get faster (not bigger) RAM.
RAM swap usage
When the system can’t find the memory it needs, it creates files on the hard disk and uses them as a sort of very slow memory.
Note
It’s worth noting that mac, Linux, and FreeBSD have an unintuitive use of swap. They will remove the swap files when no running process is referencing them, not when memory is freed. That means that a long-running process will continue to use swap files even if there is available memory.
To solve this, we should either reboot the system, restart the processes or disable and enable swap.
Network Charts
Total Bandwidth
It’s the total actual data that is being sent and received by the system.
How do I read this?
You need a baseline to read this. If you have consistently more traffic than expected, then something is off.
Important Note
Viewing your Netdata dashboard is actually heavy in network usage, as data is being streamed directly from the system to your browser. That means that you will need to look at this chart at a time when you weren’t viewing the dashboard.
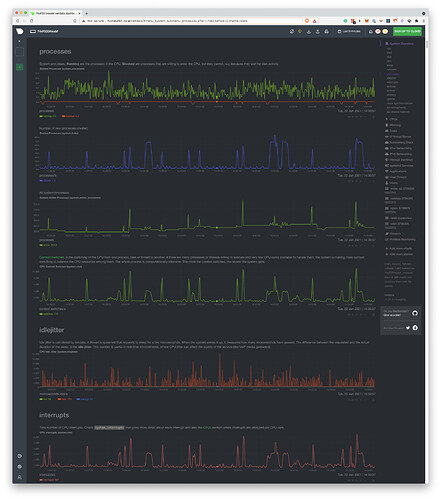
Processes Charts
Blocked processes
It shows the number of processes that want to run but are waiting for something (e.g IO).
How do I read this?
It’s relevant to the baseline of the system. To consistently have 0-1 blocked processes is normal. If you have a bad disk, the number of blocked processes will be higher. Thus, a consistently high number may indicate some bottleneck in your system.
Context switches
It’s the number of times the CPU has to change context (e.g stop a process and run another, or stop userspace to jump into kernel space and process a packet).
How do I read this?
It’s relevant to the baseline of the system. High context-switching means that the system is not running efficiently, as the system has to change the context a lot of times. It’s a very costly operation for the CPU. To rectify an issue relevant to context switching is very related to the load that you are running.
A good rule of thumb is to check this chart if you observe performance issues but all the other charts appear normal.
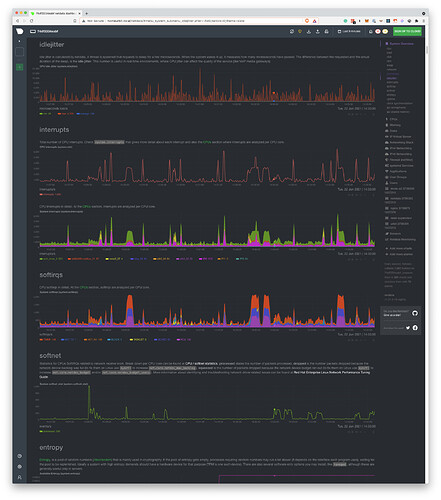
Idlejitter
It measures how “off” is the CPU when performing very carefully timed operations. It’s relevant only when you care about ** real-time** applications, such as VOIP, driving servo motors and, time servers.
Softnet
It counts network receive interrupts processed by the kernel.
How do I read this?
We mainly care about 2 dimensions that should be zero most of the time. If you can’t see them, that’s a good thing, as Netdata will not display dimensions that are 0.
droppedshould always be zero, if it is non-zero your system is having serious issues keeping up with network traffic.squeezedshould be zero, or no more than single digits. If it’s in the double digits or higher the system is having trouble keeping up, but not to the point of losing packets.
Personal computers that have been converted to homelab servers usually have non-zero dimensions, as they are not designed to handle a lot of network bandwidth.
CPU
CPU Idle
It’s a good measure of CPU utilization, but the baseline really depends on the CPU architecture.
How do I read this?
The dimensions are sorted in the legend by efficiency. That means that the higher is the dimensions to the right of the legend, the more efficient our system is.
Memory Section
OOM kills
it shows the absolute number of processes that were killed because the system could find enough memory.
How do I read this?
A healthy system should not have any OOM kill. If the dimension is non-zero, that means that the system desperately needs more memory.
As a stop-gap measure, we should add more swap memory.
Disks section
IO backlog
The number of pending operations that haven’t been dispatched yet.
How to read this?
On an ideal system, this should be zero. In practice, this sill is non-zero every now and then, simply because of the IO that the system has.
It’s relevant to the baseline of the system. You want to see observe the graph for a specific period and set your alerts above the peaks that you see.
Note that if you run backups, these are particularly taxing on IO, so you will need to take those peaks into consideration.
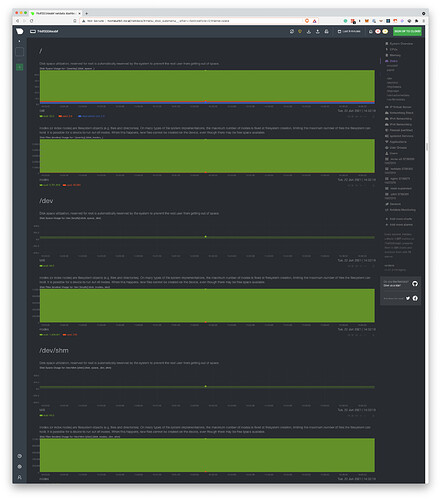
Per Filesystem
Available storage per filesystem. This is customizable.
How do I read this?
In most cases, you don’t need to. We have 2 different alerts enabled, one for available storage and one that measures the speed with which the storage is filled.
Networking Stack Section
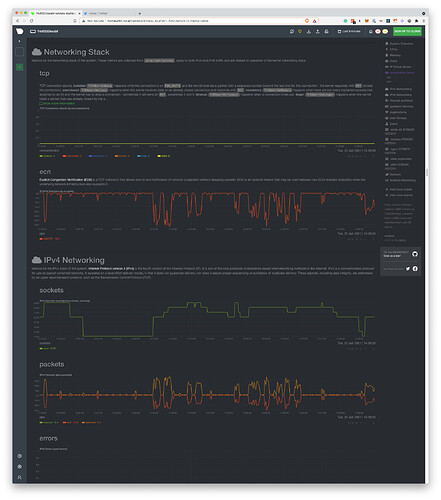
tcp
It shows TCP connection aborts.
How do I read this?
All the dimensions of this chart should be zero. If there are non-zero dimensions, that means that there is something in the network, that is not behaving well (e.g a router, the network card on the system, etc.) Consistently high numbers point to a bad network card and you will need to change that.
High numbers of connection aborts mean that your system can’t handle the number of connections, probably due to low available memory.
High numbers of time-outs mean that there is some error in the network path between your systems and the system with which you are having the connections.
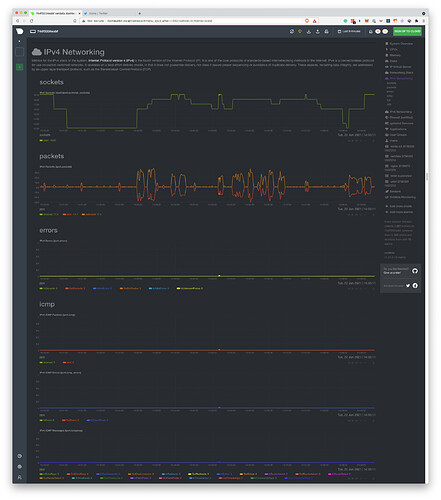
IPv4 Networking Section
errors
It shows the number of errors in the IPv4 stack of the system.
How do I read this?
All the dimensions should be zero. Constant non-zero dimensions means that the system is not functioning as expected, in regards to it’s networking.
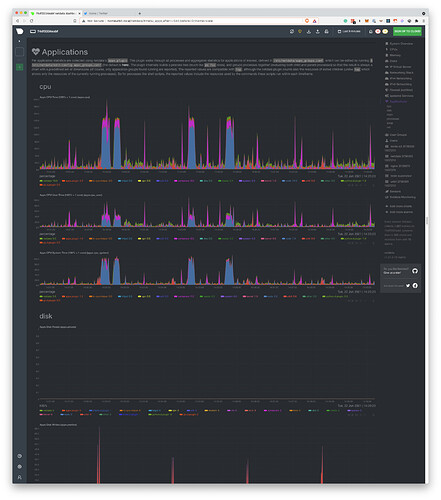
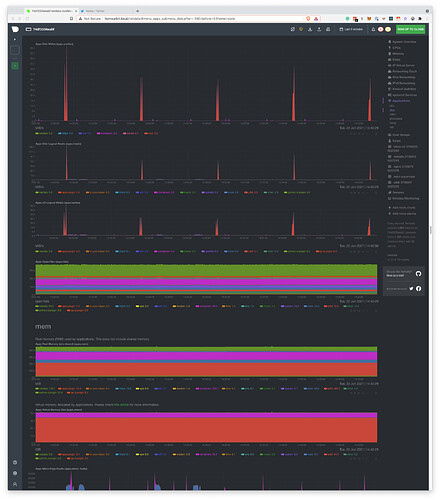
Applications Section
Interestingly, this section has the same group of metrics that are available in the System Overview Section. The difference is that they are grouped in a per application group basis.
The application groups are defined in the apps_groups.conf.
The user can customize it by running the following command. We assume that the netdata configuration lives in /etc/netdata. Depending on the installation method, this can vary.
/etc/netdata/edit-config apps_groups.conf
The reason we group different processes into application groups is that the user cares about the “functionality” of a certain application, more than they care about the implementation details.
We care about the “web server”, not if it’s nginx or appache.
Moreover, the user could care about the aggregate behaviour all the “databases” that live in the system.
How do I read this?
The workflow we follow is again, a baseline one. We live the system running under normal load to define our baseline metrics. All the readings afterward will be against that baseline.
First, you observe that the system in the aggregate is not behaving as it should, using the charts and alerts we described above. Then, we zero in the Applications Section to see what exactly is misbehaving.
Apps Open Files
It shows the open files of every application group. There is a limit, set by the system, for how many open files a process can have and how many open files the system in the aggregate can have.
How do I read this?
If the process keeps dying and there is a spike in this chart, it could signal that the particular process is opening too many files. We may need to increase the limit or investigate if the application is being unreasonable.
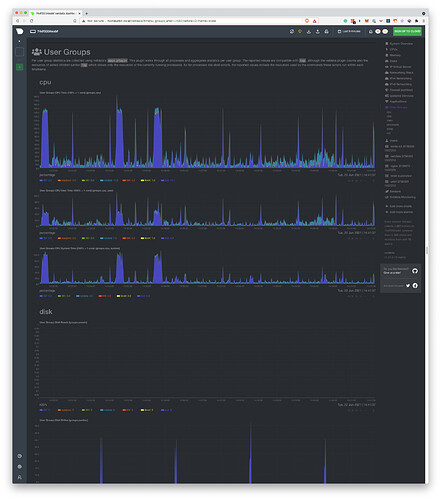
User Groups, Users Sections
These sections have the same set of charts as the Applications Section. The difference here is that the charts are grouped by User and Group respectively, instead of by Application.
cgroups virtualization, containers, etc.
As in the Users, User groups, and applications groups, Netdata will gather the same set of metrics and organize them by cgroup.
Usually, this is very useful to monitor Docker Containers, but Netdata supports many different virtualization options.
How To Connect And Mount iSCSI Onto Linux Servers
How To Connect And Mount iSCSI Onto Linux Servers
TLDR;
Discovering targets in iSCSI server:
iscsiadm –mode discovery -t sendtargets –portal 192.168.1.141 192.168.1.141:3260,1 iqn.2006-01.com.openfiler:tsn.d625a0d9cb77
login with the iSCSI LUN:
[root@machine1 ~]# iscsiadm --mode node --targetname iqn.2006-01.com.openfiler:tsn.d625a0d9cb77 --portal 192.168.1.141 --loginMount the iscsi target:
mount /dev/sdb2 /mnt
Disconnect/remove target:
umount /mnt
[root@machine1 ~]# iscsiadm –mode node –targetname iqn.2006-01.com.openfiler:tsn.d625a0d9cb77 –portal 192.168.1.141 –logout
Optionally delete the record from the database:
iscsiadm -m node -o delete -T iqn.2006-01.com.openfiler:tsn.d625a0d9cb77 –portal 192.168.1.141:3260
Details:
iscsi Server: 192.168.1.141
Centos Server: 192.168.1.137
The commands bellow should be working in other Linux distro.
First, install some needed packages.
Centos :
yum -y install iscsi-initiator-utils
service iscsid start
service iscsi start
Ubuntu:
sudo apt-get install open-iscsiOpensuse
# zypper install open-iscsiDiscovering targets in iSCSI server:
 [root@machine1 ~]# iscsiadm --mode discovery -t sendtargets --portal 192.168.1.141
192.168.1.141:3260,1 iqn.2006-01.com.openfiler:tsn.d625a0d9cb77
Trying to login with the iSCSI LUN:
[root@machine1 ~]# iscsiadm --mode node --targetname iqn.2006-01.com.openfiler:tsn.d625a0d9cb77 --portal 192.168.1.141 --loginLogging in to [iface: default, target: iqn.2006-01.com.openfiler:tsn.d625a0d9cb77, portal: 192.168.1.141,3260] (multiple) Login to [iface: default, target: iqn.2006-01.com.openfiler:tsn.d625a0d9cb77, portal: 192.168.1.141,3260] successful. [root@machine1 ~]#With this command is responsible of the update of iSCSI targets database for the files located in /var/lib/iscsi/ :
[root@machine1 ~]# cat /var/lib/iscsi/send_targets/192.168.1.141,3260/st_config
 # BEGIN RECORD 6.2.0-873.10.el6
 discovery.startup = manual
 discovery.type = sendtargets
 discovery.sendtargets.address = 192.168.1.141
 discovery.sendtargets.port = 3260
 discovery.sendtargets.auth.authmethod = None
 discovery.sendtargets.timeo.login_timeout = 15
 discovery.sendtargets.use_discoveryd = No
 discovery.sendtargets.discoveryd_poll_inval = 30
 discovery.sendtargets.reopen_max = 5
 discovery.sendtargets.timeo.auth_timeout = 45
 discovery.sendtargets.timeo.active_timeout = 30
 discovery.sendtargets.iscsi.MaxRecvDataSegmentLength = 32768
 # END RECORD
 [root@machine1 ~]#
Now check if the disk add to your machine
[root@machine1 ~]# fdisk -lDisk /dev/sda: 17.8 GB, 17791238144 bytes 255 heads, 63 sectors/track, 2162 cylinders Units = cylinders of 16065 * 512 = 8225280 bytes Sector size (logical/physical): 512 bytes / 512 bytes I/O size (minimum/optimal): 512 bytes / 512 bytes Disk identifier: 0x000a0b90Device Boot Start End Blocks Id System /dev/sda1 * 1 1275 10240000 83 Linux /dev/sda2 1275 1913 5120000 8e Linux LVM /dev/sda3 1913 2066 1228800 82 Linux swap / SolarisDisk /dev/mapper/vg_machine1-LogVol01: 209 MB, 209715200 bytes 255 heads, 63 sectors/track, 25 cylinders Units = cylinders of 16065 * 512 = 8225280 bytes Sector size (logical/physical): 512 bytes / 512 bytes I/O size (minimum/optimal): 512 bytes / 512 bytes Disk identifier: 0x00000000Disk /dev/mapper/vg_machine1-LogVol00: 2097 MB, 2097152000 bytes 255 heads, 63 sectors/track, 254 cylinders Units = cylinders of 16065 * 512 = 8225280 bytes Sector size (logical/physical): 512 bytes / 512 bytes I/O size (minimum/optimal): 512 bytes / 512 bytes Disk identifier: 0x00000000Disk /dev/sdb: 369 MB, 369098752 bytes 12 heads, 59 sectors/track, 1018 cylinders Units = cylinders of 708 * 512 = 362496 bytes Sector size (logical/physical): 512 bytes / 512 bytes I/O size (minimum/optimal): 512 bytes / 512 bytes Disk identifier: 0x00000000[root@machine1 ~]#Create file system in this disk (for new iscsi disk only)
[root@machine1 ~]# fdisk  /dev/sdb
 Device contains neither a valid DOS partition table, nor Sun, SGI or OSF disklabel
 Building a new DOS disklabel with disk identifier 0x41c55bb7.
 Changes will remain in memory only, until you decide to write them.
 After that, of course, the previous content won't be recoverable.
Warning: invalid flag 0x0000 of partition table 4 will be corrected by w(rite)WARNING: DOS-compatible mode is deprecated. It's strongly recommended to switch off the mode (command 'c') and change display units to sectors (command 'u').Command (m for help): n Command action e extended p primary partition (1-4) p Partition number (1-4): 2 First cylinder (1-1018, default 1): Using default value 1 Last cylinder, +cylinders or +size{K,M,G} (1-1018, default 1018): Using default value 1018Command (m for help): w The partition table has been altered!Calling ioctl() to re-read partition table. Syncing disks.and
[root@machine1 ~]# mkfs.ext4 /dev/sdb2
 mke2fs 1.41.12 (17-May-2010)
 Filesystem label=
 OS type: Linux
 Block size=1024 (log=0)
 Fragment size=1024 (log=0)
 Stride=0 blocks, Stripe width=0 blocks
 90112 inodes, 360340 blocks
 18017 blocks (5.00%) reserved for the super user
 First data block=1
 Maximum filesystem blocks=67633152
 44 block groups
 8192 blocks per group, 8192 fragments per group
 2048 inodes per group
 Superblock backups stored on blocks:
 8193, 24577, 40961, 57345, 73729, 204801, 221185
Writing inode tables: done Creating journal (8192 blocks): done Writing superblocks and filesystem accounting information: doneThis filesystem will be automatically checked every 37 mounts or 180 days, whichever comes first. Use tune2fs -c or -i to override.Prepare the directory to mount the disk.
[root@machine1 ~]#[root@machine1 ~]# mkdir  /iscsi-openfiler
 [root@machine1 ~]# mount  -t ext4 /dev/sdb2  /iscsi-openfiler/
 [root@machine1 ~]# df -h
 Filesystem            Size  Used Avail Use% Mounted on
 /dev/sda1             9.7G  2.4G  6.9G  26% /
 tmpfs                 751M     0  751M   0% /dev/shm
 /dev/mapper/vg_machine1-LogVol00
 2.0G   35M  1.8G   2% /home
 /dev/mapper/vg_machine1-LogVol01
 194M  5.6M  179M   4% /tmp
 /dev/sdb2             341M   11M  314M   4% /iscsi-openfiler
Please add this to mount the net drive with Linux start.
add this to /etc/fstab./dev/sdb2 /iscsi-openfiler ext4 _netdev,rw 0 0and
chkconfig  netfs  on
chkconfig  iscsi on
There are three ways to disable or delete an iSCSI target.
First, to disable an iSCSI target:
# iscsiadm --m node -T iqn.2006-01.com.openfiler:tsn.d625a0d9cb77 --portal 192.168.1.141:3260 -uSecond, it is possible to delete the target’s record ID:/p>
# iscsiadm -m node -o delete -T iqn.2006-01.com.openfiler:tsn.d625a0d9cb77 --portal 192.168.1.141:3260Thirdly, stop the iSCSI service.
Source: How To Connect And Mount iSCSI Onto Linux Servers | Unixmen
